Categories
Business Environment Lifestyle News Now! Regulations & Security Technology

IEEE publishes 2023 National Electrical Safety Code® (NESC®)

Latest Edition of the NESC Will Go into Effect in February 2023 to Help Deliver a Safer and More Sustainable Electric Power Supply


PISCATAWAY, N.J. — (BUSINESS WIRE) — #IEEESA–IEEE, the world’s largest technical professional organization dedicated to advancing technology for humanity, and the IEEE Standards Association (IEEE SA) today announced the release of the 2023 National Electrical Safety Code® (NESC®).


Published by IEEE SA and typically updated every five years to stay current with changes in the industry and technology, the NESC specifies best practices for the safety of electric supply and communication utility systems at both public and private utilities. The NESC sets the ground rules and guidelines for practical safeguarding of workers and the public during the installation, operation, or maintenance of power, telephone, cable TV, and railroad signal systems.


Just as it has done for more than a century, the NESC is continuously evolving and being refined to embrace new technologies for a more sustainable future. The potential impacts of recent and emerging technologies are reflected in the new Code.


Notable changes to the 2023 NESC include:

  • Significant revisions were made in Section 14 covering batteries, addressing new battery technologies, energy storage, and backup power.
  • A new Section 19 for photovoltaic generating stations addresses general codes, location, grounding configurations, vegetation management, DC overcurrent protection, and DC conductors. These new rules accommodate large-scale solar power projects.
  • All stand-alone tables for metric measurements have been removed from the main code body and moved to Annex 1. For tables that include both English and metric values, the revised Code presents numerical values in the customary “inch-foot-pound” system first and the corresponding metric values following in parentheses to help prevent misreading errors.
  • In the Clearances section, as well as in the specification of the Grade of Construction, the Code further clarifies the use of non-hazardous fiber optic cables.


“The 2023 NESC includes updates throughout, many of which address emerging technologies such as solar and wind energy, distributed energy/microgrids, batteries and energy storage, and wireless small cell networks,” said Nelson Bingel, chair of the NESC Committee. “We’re grateful to the many participants who contributed to the 2023 edition, and we welcome new contributors to join our NESC team.”


Like previous versions, the 2023 edition will be available in digital, printed, e-learning, and mobile-app formats. This edition consists of initial sections covering scope, purpose, and grounding methods, followed by sections that include specific rules for electric supply stations, overhead lines, underground lines, and safety-related work practices.


A companion document, the 2023 NESC Handbook, is available with the Code. The Handbook includes all of the rules of the Code but also provides insights and commentary on the rules and how to apply them from the experts who helped develop the Code, including historical notes to provide context for Code revisions and additions.


Information on updates to the code can be found on the NESC homepage. The 2023 NESC and handbook are available for purchase at the IEEE Standards store and available for subscription at the IEEE Xplore® Digital Library.


About IEEE SA

IEEE Standards Association (IEEE SA) is a collaborative organization where innovators raise the world’s standards for technology. IEEE SA provides a globally open, consensus-building environment and platform that empowers people to work together in the development of leading-edge, market-relevant technology standards, and industry solutions shaping a better, safer and sustainable world. Learn more about IEEE SA.


About IEEE

IEEE is the world’s largest technical professional organization dedicated to advancing technology for the benefit of humanity. Through its highly cited publications, conferences, technology standards, and professional and educational activities, IEEE is the trusted voice in a wide variety of areas ranging from aerospace systems, computers, and telecommunications to biomedical engineering, electric power, and consumer electronics. Learn more about IEEE.


Contacts

Media
Tania Olabi-Colon, Brand Marketing & Communications Director

Olivia Wang, Marketing & Communications Manager

standards-pr@ieee.org

Categories
Business Special/Sponsored Content

Thomas Park Investments reports strong first half with $75M in MOB acquisitions

Company Expands into Southeast with Raleigh, North Carolina Purchase


ANNAPOLIS, Md. — (BUSINESS WIRE) — Thomas Park Investments closed the first half of 2022 with $75 million in medical office building (MOB) acquisitions, halfway toward the company’s goal of $150 million in acquisitions this year. The acquisitions include a purchase in Raleigh, North Carolina, signaling the company’s expansion into the southeast.

“These acquisitions add some of the most trusted names in health care to our roster of tenants, including Duke Health, UNC Physicians Network, Penn Medicine, University of Maryland Medical System, South Shore Health, and St. Luke’s,” says EJ Rumpke, Thomas Park’s Chief Executive Officer. “We’re pleased with the increased diversity of tenants and health systems these recent acquisitions bring to our portfolio.”


First half acquisitions include:

  • 8300 Health Park in Raleigh, North Carolina. This 178,000-square foot MOB was acquired off-market and is anchored by Carolina Family Practice & Sports Medicine (Duke Health), Boylan Healthcare (UNC Physicians Network), Healthtrax, and Raleigh Endoscopy.
  • 5000 Dearborn Circle in Mt. Laurel, New Jersey. This 56,000-square-foot MOB is anchored by Penn Medicine and was acquired in an off-market transaction. This core plus acquisition expands Thomas Park’s presence in the greater Philadelphia market.
  • 8322 Bellona Avenue in Baltimore, Maryland. This 56,000-square-foot MOB was acquired off market in a partial sale-leaseback. The building is anchored by Towson Orthopaedic Associates, part of the University of Maryland St. Joseph Medical Center.
  • 223 Chief Justice Cushing Parkway in Cohasset, Massachusetts. The 35,000-square-foot core plus purchase was acquired off market and is in a highly desirable and affluent submarket of Boston. It’s anchored by HealthCare South and South Shore Children’s Dentistry.
  • 5325 Northgate Drive in Bethlehem, Pennsylvania. This 53,000-square-foot value-add purchase involves a partial sale-leaseback. Anchor tenants include Wills Eye Physicians (Mid Atlantic Retina), Radiology & MRI of Bethlehem, and Bethlehem Endoscopy.


“Our significant growth says a lot about the caliber of our team,” says Thomas Park’s Chief Operating Officer Gene Parker. “And our growth has fueled a hiring expansion, raising our headcount by 125% since the beginning of the year.”


According to Alex Kopicki, Thomas Park’s Chief Investment Officer, rising interest rates will not slow the company’s momentum. “We have a knack for finding good real estate that can weather the short-term volatility of the debt markets, as we predominantly have a long-term outlook on the health care real estate sector,” he said.


About Thomas Park Investments

Thomas Park Investments is a leading private equity real estate firm specializing in health care real estate. Founded in 2019, Thomas Park’s leadership has more than sixty years of commercial real estate experience and manages more than 825,000 square feet of commercial space. The Annapolis, Maryland based firm is on pace to have $1 billion of assets under management by 2025. For more information, visit thomas-park.com.


Photos available upon request.

Contacts

For more information contact:
Kristy Myers, Cardinal Thread

240-434-1274

kristy@cardinalthread.com

Categories
Business Culture

B&G Foods announces date of second quarter 2022 earnings conference call

PARSIPPANY, N.J. — (BUSINESS WIRE) — B&G Foods, Inc. (NYSE: BGS) announced today that it intends to issue a press release with second quarter 2022 financial results after the market close on Thursday, August 4, 2022. B&G Foods has scheduled a conference call at 4:30 p.m. ET that same day to discuss the results. Hosting the call will be Casey Keller, President and Chief Executive Officer and Bruce Wacha, Executive Vice President of Finance and Chief Financial Officer.


The earnings press release and live audio webcast of the conference call can be accessed at www.bgfoods.com/investor-relations. A replay of the webcast will be available following the conference call through the same link.


About B&G Foods, Inc.

Based in Parsippany, New Jersey, B&G Foods and its subsidiaries manufacture, sell and distribute high-quality, branded shelf-stable and frozen foods across the United States, Canada and Puerto Rico. With B&G Foods’ diverse portfolio of more than 50 brands you know and love, including Back to Nature, B&G, B&M, Bear Creek, Cream of Wheat, Crisco, Dash, Green Giant, Las Palmas, Le Sueur, Mama Mary’s, Maple Grove Farms, New York Style, Ortega, Polaner, Spice Islands and Victoria, there’s a little something for everyone. For more information about B&G Foods and its brands, please visit www.bgfoods.com.

Contacts

Investor Relations:

ICR, Inc.

Dara Dierks

866.211.8151

Media Relations:

ICR, Inc.

Matt Lindberg

203.682.8214

Categories
Business

AM Best downgrades credit ratings of Kingstone Insurance Company; downgrades and withdraws credit ratings of Kingstone Companies, Inc.

OLDWICK, N.J. — (BUSINESS WIRE) — #insuranceAM Best has downgraded the Financial Strength Rating to B (Fair) from B+ (Good) and the Long-Term Issuer Credit Rating (Long-Term ICR) to “bb” (Fair) from “bbb-” (Good) of Kingstone Insurance Company (KICO) (Kingston, NY). Concurrently, AM Best has downgraded the Long-Term ICR to “b-” (Marginal) from “bb-” (Fair) and its associated securities for Kingstone Companies, Inc. (KINS) (Delaware), the insurance holding company of KICO. The outlook of these Credit Ratings (ratings) was revised to negative from stable. Concurrently, AM Best has withdrawn all of the public ratings of KINS. See below for a detailed listing of KINS’ Long-Term Issue Credit Ratings (Long-Term IR) and Indicative Credit Ratings that were also withdrawn.

The ratings of KICO reflect its balance sheet strength, which AM Best assesses as adequate, as well as its adequate operating performance, limited business profile and marginal enterprise risk management (ERM).


The ratings downgrade is driven by significant deterioration in KICO’s risk-adjusted capitalization that occurred across all return periods due to a sizeable increase in the net probable maximum loss (PML); this was a result of its latest reinsurance renewal, and a decline in surplus from weather-related losses and dividend payments in 2022. The sizeable differential in PMLs was driven by the dislocation in the catastrophe reinsurance markets in June, leading to management’s inability to secure the same limit as the prior year and purchasing substantially less catastrophe reinsurance as a result. This impact has resulted in AM Best revising KICO’s ERM assessment to marginal from appropriate. The net probable maximum loss for a 1-in-100 year loss return period accounts for a significant percentage of the company’s surplus as of Q1/2022. Therefore, the company’s risk appetite, tolerances, and the composition of its latest reinsurance structure are not commensurate with an ERM assessment of appropriate. The outlook change of these credit ratings to negative primarily reflects the deteriorating underwriting results for year-end 2021 and the first quarter of 2022 that were driven mainly by weather-related losses.


AM Best considers KICO’s exposure to environmental, social and governance issues to be material due to its coastal concentration and associated climate risk with changing weather patterns. In addition, KICO’s net PML for the 100 year return period remains elevated, placing potential pressure on surplus.


The following Long-Term IR has been downgraded with the outlook revised to negative from stable, and the public rating subsequently withdrawn, for Kingstone Companies, Inc.:

— to “ccc+” (Weak) from “bb-” (Fair) on $30.0 million 5.5% senior unsecured notes, due 2022

The following indicative Long-Term IRs have been downgraded with the outlook revised to negative from stable, and the public rating subsequently withdrawn, for Kingstone Companies, Inc.:

— to “ccc+” (Weak) from “bb-” (Fair) on senior unsecured notes

— to “ccc” (Weak) from “b+” (Marginal) on subordinated notes


This press release relates to Credit Ratings that have been published on AM Best’s website. For all rating information relating to the release and pertinent disclosures, including details of the office responsible for issuing each of the individual ratings referenced in this release, please see AM Best’s Recent Rating Activity web page. For additional information regarding the use and limitations of Credit Rating opinions, please view Guide to Best’s Credit Ratings. For information on the proper use of Best’s Credit Ratings, Best’s Performance Assessments, Best’s Preliminary Credit Assessments and AM Best press releases, please view Guide to Proper Use of Best’s Ratings & Assessments.


AM Best is a global credit rating agency, news publisher and data analytics provider specializing in the insurance industry. Headquartered in the United States, the company does business in over 100 countries with regional offices in London, Amsterdam, Dubai, Hong Kong, Singapore and Mexico City. For more information, visit www.ambest.com.


Copyright © 2022 by A.M. Best Rating Services, Inc. and/or its affiliates. ALL RIGHTS RESERVED.

Contacts

Adib Nassery
Senior Financial Analyst
+1 908 439 2200, ext. 5205
adib.nassery@ambest.com

Christopher Sharkey
Manager, Public Relations
+1 908 439 2200, ext. 5159
christopher.sharkey@ambest.com

Richard Attanasio
Senior Director
+1 908 439 2200, ext. 5432
richard.attanasio@ambest.com

Jeff Mango
Managing Director,
Strategy & Communications
+1 908 439 2200, ext. 5204
jeffrey.mango@ambest.com

Categories
Business Culture Regulations & Security

Only 12% of U.S. jobs posted online disclose salary, but 98% of job seekers say it’s important to know the salary before applying, according to New Talent.com survey

In advance of the Pay Transparency Law that takes effect in November 2022, Talent.com, the world’s fastest-growing job search platform, conducted a survey that revealed a massive gap between companies disclosing salary in job postings and the candidates’ application habits. Findings show why employers aren’t attracting top talent and the reasons many job seekers are missing out on their dream jobs. Full report here.


MONTREAL — (BUSINESS WIRE) — Talent.com Inc. conducted a survey of 2,000 currently employed or job seeking residents of New York, New Jersey or Pennsylvania in May and June with the goal of evaluating the importance of salary disclosure in job postings online to respondents when seeking a new position. The survey was inspired by the Salary Transparency in Job Advertisements Law that will start November 1, 2022 in New York City. All employers with four or more employees or one or more domestic workers are covered by this new provision of the law stating they must include a good faith salary range for every job, promotion, and transfer opportunity advertised.


As the fastest-growing player in next-generation job search platforms, Talent.com’s survey offers unique insight into the deficiencies between job seekers connecting with prospective employers. For the survey respondents living in New York, 70% had never heard about the upcoming new transparency law. Salary was the most important factor employees considered when looking for a new job according to 77%. An astounding 98% of survey respondents said it was important for them to know job salary before considering applying, but according to Talent.com’s data in June 2022 – only 12% of U.S. jobs offered online disclose salary information. In terms of age, salary was considered more important to those 55+ when compared to the 18-34 age group, 84% versus 52% respectively. Report here.


“Our salary survey clearly shows the major problem that is causing U.S. employers to have difficulties attracting and retaining top talent in the current job market,” said Lucas Martinez, Co-CEO of Talent.com. “A high percentage of organizations say their hires are not quality hires. This can be greatly improved by eliminating friction in the hiring and interviewing process – starting with complete salary transparency. We look forward to more online job postings revealing salary ranges in 2022,” concluded Martinez.


About Talent.com

Talent.com is one of the world’s fastest-growing next-generation job search platforms helping businesses find candidates no matter their budget, number of job openings or technological capabilities. Based in Montreal, Canada, with 8 offices around the world, our dedicated team adapts to the job posting requirements of our clients and helps them grow. Available in 78 countries and working with an extensive network of publishing partners, we adapt our solutions to the needs of small businesses all the way to enterprise clients, so you can find talent – your way. Visit https://www.talent.com/ to learn more.

Contacts

Ben Goldsmith

+44(0)7788295321

ben@goldsmithcomms.com

Categories
Business Lifestyle Science

Best’s Market Segment Report: U.S. Crop Writers post record-high premium growth on rising commodity prices and innovation

OLDWICK, N.J. — (BUSINESS WIRE) — Premiums in the federal multi-peril crop insurance (MPCI) program surged in 2021 to a record high of $14.9 billion, an increase of nearly 40% over the previous year, according to an AM Best report.

The new Best’s Market Segment Report, titled, “U.S. Crop Writers Benefit From Rising Commodity Prices and Innovation,” also states that private crop insurers also experienced a record-high jump in premium as well, to $1.3 billion from $1.1 billion in 2020. Private crop products largely consist of crop hail insurance and other covers that are not government-subsidized, and can be combined with MPCI or other protections to reduce deductibles and increase coverage up to the actual cash value of the crop. The MPCI program covered more than 444 million acres in 2021, with an estimated value of more than $150 billion.


“Commodity prices have risen significantly since 2019, driving MPCI rate increases and solid premium growth,” said Connor Brach, senior financial analyst, AM Best. “Losses stabilized due to more favorable growing conditions as well as rising prices.”


Revenue policies make up the bulk of the premium for the MPCI program, according to the report, so the loss ratio for revenue products has the most significant impact on the overall results of the program. In 2019, the loss ratio for revenue policies peaked at 106.7 amid unprecedented prevented planting claims, but has been much lower the past two years, dropping to 58.6 in 2021.


The combined ratio of MPCI writers was 94.9 in 2021, down from a peak of 108.6 in 2019, while private crop insurers recorded a combined ratio of 122.0, a 24.9 percentage-point improvement from the previous year. Despite the improved segment performance, challenging market and macroeconomic conditions, including inflation and rising costs for fertilizer, diesel, herbicides, labor and other inputs, are pressuring farmers’ returns.


“Higher diesel prices have had a particularly significant impact on farmers, as they rely heavily on diesel for food harvesting and transport,” said David Blades, associate director, industry research and analytics, AM Best. “Supply chain bottlenecks also has limited the availability of new machinery, as well as parts to maintain older equipment, while higher interest rates are raising borrowing costs for expanding or reinvesting in a farm.”


Innovative technology, such as drone and robotic tools, has enhanced farming efficiency and productivity, diminishing the industry’s sensitivity to weather extremes and natural biological threats, to the benefit of crop insurers. Irrigation drones can adapt to variables such as altitude, types of plants being grown and weather conditions.


To access the full copy of this market segment report, please visit http://www3.ambest.com/bestweek/purchase.asp?record_code=322282.


AM Best is a global credit rating agency, news publisher and data analytics provider specializing in the insurance industry. Headquartered in the United States, the company does business in over 100 countries with regional offices in London, Amsterdam, Dubai, Hong Kong, Singapore and Mexico City. For more information, visit www.ambest.com.


Copyright © 2022 by A.M. Best Rating Services, Inc. and/or its affiliates. ALL RIGHTS RESERVED.

Contacts

Connor Brach, FRM
Senior Financial Analyst
+1 908 439 2200, ext. 5573
connor.brach@ambest.com

Christopher Sharkey
Manager, Public Relations
+1 908 439 2200, ext. 5159
christopher.sharkey@ambest.com

David Blades
Associate Director, Industry
Research and Analytics
+1 908 439 2200, ext. 5422
david.blades@ambest.com

Jeff Mango
Managing Director,
Strategy & Communications
+1 908 439 2200, ext. 5204
jeffrey.mango@ambest.com

Categories
Business Lifestyle Local News

Essential Properties announces second quarter 2022 results

– Second Quarter Net Income per Share of $0.27 and AFFO per Share of $0.38 –

– Closed Investments of $175.7 million at a 7.0% Weighted Average Cash Cap Rate –

– Increases 2022 AFFO Guidance to $1.52 to $1.54 per Share –


PRINCETON, N.J. — (BUSINESS WIRE) — Essential Properties Realty Trust, Inc. (NYSE: EPRT; “Essential Properties” or the “Company”) today announced operating results for the three and six months ended June 30, 2022.

Second Quarter 2022 Financial and Operating Highlights:

Operating Results (compared to Second Quarter 2021):

  • Investments (39 properties)

$ Invested

$175.7 million

Weighted Avg Cash Cap Rate

7.0%

  • Dispositions (8 properties)

Net Proceeds

$26.1 million

Weighted Avg Cash Cap Rate

6.2%

  • Net Income per Share

Increased by 35%

$0.27

  • Funds from Operations (“FFO”) per Share

Increased by 28%

$0.41

  • Core Funds from Operations (“Core FFO”) per Share

Increased by 17%

$0.41

  • Adjusted Funds from Operations (“AFFO”) per Share

Increased by 12%

$0.38

Equity Activity:

  • Equity Raised (Gross) – ATM Program

$21.74/share

$32.6 million


Year to Date 2022 Financial and Operating Highlights:

Operating Results (compared to YTD Second Quarter 2021):

  • Investments (144 properties)

$ Invested

$413.5 million

Weighted Avg Cash Cap Rate

7.0%

  • Dispositions (14 properties)

Net Proceeds

$44.5 million

Weighted Avg Cash Cap Rate

6.6%

  • Net Income per share

Increased by 41%

$0.48

  • FFO per share

Increased by 32%

$0.79

  • Core FFO per share

Increased by 27%

$0.81

  • AFFO per share

Increased by 23%

$0.76

Equity Activity:

  • Equity Raised (Gross) – ATM Program

$24.39/share

$192.3 million

Highlights Subsequent to Second Quarter 2022:

  • Investments (6 properties)

$ Invested

$45.7 million

Equity & Debt Activity:

  • Equity Raised (Gross) – ATM Program

$21.57/share

$20.5 million

  • New 2028 Term Loan

5.5 Year Tenor; Adjusted Term SOFR + 95 bps

$400.0 million


CEO Comments

Commenting on the second quarter 2022 results, the Company’s President and Chief Executive Officer, Pete Mavoides, said, “The portfolio’s strong operating performance continued into the second quarter with high occupancy, solid same-store rent growth, and increased unit-level coverage.” Mr. Mavoides continued, “Despite a challenging capital market environment, our established tenant relationships and direct origination process allowed us to invest at favorable yields once again this quarter. With a robust investment pipeline and our well-priced debt execution recharging our low-levered balance sheet for growth, we are increasing our 2022 AFFO per share guidance to $1.52 to $1.54.”


Portfolio Update

Investments

The Company’s investment activity during the three and six months ended June 30, 2022 is summarized as follows:


Quarter Ended

June 30, 2022

Year to Date

June 30, 2022

Investments:

$ Invested

$175.7 million

$413.5 million

# of Properties

39

144

# of Separate Transactions

23

46

Weighted Average Cash / GAAP Cap Rate

7.0%/8.0%

7.0%/7.9%

Weighted Average Lease Term (WALT)

17.2 years

15.9 years

% Sale-Leaseback Transactions

100%

100%

% Subject to Master Lease

86%

84%

% Required Financial Reporting (tenant/guarantor)

100%

100%


Dispositions

The Company’s disposition activity during the three and six months ended June 30, 2022 is summarized as follows:


Quarter Ended

June 30, 2022

Year to Date

June 30, 2022

Dispositions:

Net Proceeds

$26.1 million

$44.5 million

# of Properties Sold

8

14

Net Gain / (Loss)

$10.1 million

$11.8 million

Weighted Average Cash Cap Rate (excluding vacant properties and sales subject to a tenant purchase option )

6.2%

6.6%


Loan Repayments

Loan repayments to the Company during the three and six months ended June 30, 2022 are summarized as follows:


Quarter Ended

June 30, 2022

Year to Date

June 30, 2022

Proceeds—Principal

$37.8 million

$48.4 million

Proceeds—Prepayment Penalties

$0.3 million

$0.4 million

# of Properties

15

20


Portfolio Highlights

The Company’s investment portfolio as of June 30, 2022 is summarized as follows:


Number of properties

1,561

WALT

13.8 years

Weighted average rent coverage ratio

4.0x

Number of tenants

322

Number of states

46

Number of industries

16

Weighted average occupancy

99.9%

Total square feet of rentable space

14,401,377

Cash ABR – service-oriented or experience-based

93.1%

Cash ABR – properties subject to master lease

63.8%


Leverage and Balance Sheet and Liquidity

The Company’s leverage, balance sheet and liquidity are summarized in the following table.


June 30, 2022

Leverage:

Net debt to Annualized Adjusted EBITDAre

4.7x

Balance Sheet and Liquidity:

Cash and cash equivalents and restricted cash

$26.2 million

Unused borrowing capacity

$382.0 million

Total available liquidity

$408.2 million

ATM Program:

2022 ATM Program initial availability

$500.0 million

Aggregate gross sales under the 2022 ATM Program

$32.6 million

Availability remaining under the 2022 ATM Program

$467.4 million

Average price per share of gross sales to date

$21.74


Subsequent Debt Activity

In July 2022, the Company entered into a new term loan permitting up to $400.0 million of borrowings. The below table provides a summary of this new debt agreement.


2028 Term Loan

Maturity Date

January 2028

Initial Principal Drawn

$250.0 million

Maximum Available Principal

$400.0 million

Delayed Draw Period

90 Days

Interest Rate

Adjusted Term SOFR + 95 bps(1)

________________

1.

Includes 10 bps SOFR premium adjustment.


Dividend Information

As previously announced, on June 2, 2022 Essential Properties’ board of directors declared a cash dividend of $0.27 per share of common stock for the quarter ended June 30, 2022. The dividend was paid on July 14, 2022 to stockholders of record as of the close of business on June 30, 2022.


Guidance

2022 Guidance

The Company is increasing its expectation that 2022 AFFO per share on a fully diluted basis will be within a range of $1.52 to $1.54 from its previously announced range of $1.50 to $1.53.


Note: The Company does not provide guidance for the most comparable GAAP financial measure, net income, or a reconciliation of the forward-looking non-GAAP financial measure of AFFO to net income computed in accordance with GAAP, because it is unable to reasonably predict, without unreasonable efforts, certain items that would be contained in the GAAP measure, including items that are not indicative of the Company’s ongoing operations, such as, without limitation, potential impairments of real estate assets, net gain/loss on dispositions of real estate assets, changes in allowance for credit losses and stock-based compensation expense. These items are uncertain, depend on various factors, and could have a material impact on the Company’s GAAP results for the guidance periods.


Conference Call Information

In conjunction with the release of Essential Properties’ operating results, the Company will host a conference call on Friday, July 29, 2022 at 11:00 a.m. EDT to discuss the results. To access the conference, dial 877-407-9208 (International: 201-493-6784). A live webcast will also be available in listen-only mode by clicking on the webcast link in the Investor Relations section at www.essentialproperties.com.


A telephone replay of the conference call can also be accessed by calling 844-512-2921 (International: 412-317-6671) and entering the access code: 13731457. The telephone replay will be available through August 12, 2022.


A replay of the conference call webcast will be available on our website approximately two hours after the conclusion of the live broadcast. The webcast replay will be available for 90 days. No access code is required for this replay.


Supplemental Materials

The Company’s Supplemental Operating & Financial Data—Second Quarter Ended June 30, 2022 is available on Essential Properties’ website at investors.essentialproperties.com.


About Essential Properties Realty Trust, Inc.

Essential Properties Realty Trust, Inc. is an internally managed REIT that acquires, owns and manages primarily single- tenant properties that are net leased on a long-term basis to companies operating service-oriented or experience-based businesses. As of June 30, 2022, the Company’s portfolio consisted of 1,561 freestanding net lease properties with a weighted average lease term of 13.8 years and a weighted average rent coverage ratio of 4.0x. In addition, as of June 30, 2022, the Company’s portfolio was 99.9% leased to 322 tenants operating 469 different concepts in 16 industries across 46 states.


Forward-Looking Statements

This press release contains forward-looking statements within the meaning of the federal securities laws. When used in this press release, the words “estimate,” “anticipate,” “expect,” “believe,” “intend,” “may,” “will,” “should,” “seek,” “approximately” or “plan,” or the negative of these words and phrases or similar words or phrases that are predictions of or indicate future events or trends and that do not relate solely to historical matters are intended to identify forward-looking statements. You can also identify forward-looking statements by discussions of strategy, plans or intentions of management. Forward-looking statements involve numerous risks and uncertainties and you should not rely on them as predictions of future events. Forward-looking statements depend on assumptions, data or methods that may be incorrect or imprecise and the Company may not be able to realize them. The Company does not guarantee that the transactions and events described will happen as described (or that they will happen at all). You are cautioned not to place undue reliance on forward-looking statements, which speak only as of the date of this press release. While forward-looking statements reflect the Company’s good faith beliefs, they are not guarantees of future performance. The Company undertakes no obligation to publicly release the results of any revisions to these forward-looking statements that may be made to reflect events or circumstances after the date of this press release or to reflect the occurrence of unanticipated events, except as required by law. In light of these risks and uncertainties, the forward-looking events discussed in this press release might not occur as described, or at all.


Additional information concerning factors that could cause actual results to differ materially from these forward-looking statements is contained in the company’s Securities and Exchange Commission (the “Commission”) filings, including, but not limited to, the Company’s most recent Annual Report on Form 10-K and subsequent Quarterly Reports on Form 10-Q. Copies of each filing may be obtained from the Company or the Commission. Such forward-looking statements should be regarded solely as reflections of the Company’s current operating plans and estimates. Actual operating results may differ materially from what is expressed or forecast in this press release.


The results reported in this press release are preliminary and not final. There can be no assurance that these results will not vary from the final results reported in the Company’s Quarterly Report on Form 10-Q for the quarter ended June 30, 2022 that it will file with the Commission.


Non-GAAP Financial Measures and Certain Definitions

The Company’s reported results are presented in accordance with GAAP. The Company also discloses the following non-GAAP financial measures: FFO, Core FFO, AFFO, earnings before interest, taxes, depreciation and amortization (“EBITDA”), EBITDA further adjusted to exclude gains (or losses) on sales of depreciable property and real estate impairment losses (“EBITDAre”), adjusted EBITDAre, annualized adjusted EBITDAre, net debt, net operating income (“NOI”) and cash NOI (“Cash NOI”). The Company believes these non-GAAP financial measures are industry measures used by analysts and investors to compare the operating performance of REITs.


FFO, Core FFO and AFFO

The Company computes FFO in accordance with the definition adopted by the Board of Governors of the National Association of Real Estate Investment Trusts (“NAREIT”). NAREIT defines FFO as GAAP net income or loss adjusted to exclude extraordinary items (as defined by GAAP), net gain or loss from sales of depreciable real estate assets, impairment write-downs associated with depreciable real estate assets and real estate-related depreciation and amortization (excluding amortization of deferred financing costs and depreciation of non-real estate assets), including the pro rata share of such adjustments of unconsolidated subsidiaries. FFO is used by management, and may be useful to investors and analysts, to facilitate meaningful comparisons of operating performance between periods and among the Company’s peers primarily because it excludes the effect of real estate depreciation and amortization and net gains and losses on sales (which are dependent on historical costs and implicitly assume that the value of real estate diminishes predictably over time, rather than fluctuating based on existing market conditions).


The Company computes Core FFO by adjusting FFO, as defined by NAREIT, to exclude certain GAAP income and expense amounts that it believes are infrequent and unusual in nature and/or not related to its core real estate operations. Exclusion of these items from similar FFO-type metrics is common within the equity REIT industry, and management believes that presentation of Core FFO provides investors with a metric to assist in their evaluation of our operating performance across multiple periods and in comparison to the operating performance of our peers, because it removes the effect of unusual items that are not expected to impact our operating performance on an ongoing basis.


Core FFO is used by management in evaluating the performance of our core business operations. Items included in calculating FFO that may be excluded in calculating Core FFO include certain transaction related gains, losses, income or expense or other non-core amounts as they occur.


To derive AFFO, the Company modifies its computation of Core FFO to include other adjustments to GAAP net income related to certain items that it believes are not indicative of the Company’s operating performance, including straight-line rental revenue, non-cash interest expense, non-cash compensation expense, other amortization expense, other non-cash charges (including changes to our provision for loan losses following the adoption of ASC 326), capitalized interest expense and transaction costs. Such items may cause short-term fluctuations in net income but have no impact on operating cash flows or long-term operating performance. The Company believes that AFFO is an additional useful supplemental measure for investors to consider when assessing the Company’s operating performance without the distortions created by non-cash items and certain other revenues and expenses.


FFO, Core FFO and AFFO do not include all items of revenue and expense included in net income, they do not represent cash generated from operating activities and they are not necessarily indicative of cash available to fund cash requirements; accordingly, they should not be considered alternatives to net income as a performance measure or cash flows from operations as a liquidity measure and should be considered in addition to, and not in lieu of, GAAP financial measures. Additionally, our computation of FFO, Core FFO and AFFO may differ from the methodology for calculating these metrics used by other equity REITs and, therefore, may not be comparable to similarly titled measures reported by other equity REITs.


EBITDA and EBITDAre

The Company computes EBITDA as earnings before interest, income taxes and depreciation and amortization. In 2017, NAREIT issued a white paper recommending that companies that report EBITDA also report EBITDAre. The Company computes EBITDAre in accordance with the definition adopted by NAREIT. NAREIT defines EBITDAre as EBITDA (as defined above) excluding gains (or losses) from the sales of depreciable property and real estate impairment losses. The Company presents EBITDA and EBITDAre as they are measures commonly used in its industry and the Company believes that these measures are useful to investors and analysts because they provide supplemental information concerning its operating performance, exclusive of certain non-cash items and other costs. The Company uses EBITDA and EBITDAre as measures of its operating performance and not as measures of liquidity.


EBITDA and EBITDAre do not include all items of revenue and expense included in net income, they do not represent cash generated from operating activities and they are not necessarily indicative of cash available to fund cash requirements; accordingly, they should not be considered alternatives to net income as a performance measure or cash flows from operations as a liquidity measure and should be considered in addition to, and not in lieu of, GAAP financial measures. Additionally, the Company’s computation of EBITDA and EBITDAre may differ from the methodology for calculating these metrics used by other equity REITs and, therefore, may not be comparable to similarly titled measures reported by other equity REITs.


Net Debt

The Company calculates its net debt as its gross debt (defined as total debt plus net deferred financing costs on its secured borrowings) less cash and cash equivalents and restricted cash available for future investment. The Company believes excluding cash and cash equivalents and restricted cash available for future investment from gross debt, all of which could be used to repay debt, provides an estimate of the net contractual amount of borrowed capital to be repaid, which it believes is a beneficial disclosure to investors and analysts.


NOI and Cash NOI

The Company computes NOI as total revenues less property expenses. NOI excludes all other items of expense and income included in the financial statements in calculating net income or loss. Cash NOI further excludes non-cash items included in total revenues and property expenses, such as straight-line rental revenue and other amortization and non-cash charges. The Company believes NOI and Cash NOI provide useful information because they reflect only those revenue and expense items that are incurred at the property level and present such items on an unlevered basis.


NOI and Cash NOI are not measures of financial performance under GAAP. You should not consider the Company’s NOI and Cash NOI as alternatives to net income or cash flows from operating activities determined in accordance with GAAP. Additionally, the Company’s computation of NOI and Cash NOI may differ from the methodology for calculating these metrics used by other equity REITs and, therefore, may not be comparable to similarly titled measures reported by other equity REITs.


Adjusted EBITDAre / Adjusted NOI / Adjusted Cash NOI

The Company further adjusts EBITDAre, NOI and Cash NOI i) based on an estimate calculated as if all investment and disposition activity that took place during the quarter had occurred on the first day of the quarter, ii) to exclude certain GAAP income and expense amounts that the Company believes are infrequent and unusual in nature and iii) to eliminate the impact of lease termination or loan prepayment fees and contingent rental revenue from its tenants which is subject to sales thresholds specified in the lease. The Company then annualizes these estimates for the current quarter by multiplying them by four, which it believes provides a meaningful estimate of the Company’s current run rate for all investments as of the end of the current quarter. You should not unduly rely on these measures, as they are based on assumptions and estimates that may prove to be inaccurate. The Company’s actual reported EBITDAre, NOI and Cash NOI for future periods may be significantly less than these estimates of current run rates.


Cash ABR

Cash ABR means annualized contractually specified cash base rent in effect as of the end of the current quarter for all of the Company’s leases (including those accounted for as direct financing leases) commenced as of that date and annualized cash interest on its mortgage loans receivable as of that date.


Cash Cap Rate

Cash Cap Rate means annualized contractually specified cash base rent for the first full month after investment or disposition divided by the purchase or sale price, as applicable, for the property.


GAAP Cap Rate

GAAP Cap Rate means annualized rental income computed in accordance with GAAP for the first full month after investment divided by the purchase price, as applicable, for the property.


Rent Coverage Ratio

Rent coverage ratio means the ratio of tenant-reported or, when unavailable, management’s estimate based on tenant-reported financial information, annual EBITDA and cash rent attributable to the leased property (or properties, in the case of a master lease) to the annualized base rental obligation as of a specified date.


Disclaimer

Essential Properties Realty Trust, Inc. and the Essential Properties Realty Trust REIT are not affiliated with or sponsored by Griffin Capital Essential Asset Operating Partnership, L.P. or the Griffin Capital Essential Asset REIT, information about which can be obtained at (https://www.gcear.com).


Essential Properties Realty Trust, Inc.

Consolidated Statements of Operations

Three months ended June 30,

Six months ended June 30,

(in thousands, except share and per share data)

2022

2021

2022

2021

(unaudited)

(unaudited)

(unaudited)

(unaudited)

Revenues:

Rental revenue1,2

$

67,089

$

53,150

$

133,201

$

98,582

Interest on loans and direct financing lease receivables

3,949

3,879

7,771

6,984

Other revenue

408

37

595

52

Total revenues

71,446

57,066

141,567

105,618

Expenses:

General and administrative

7,026

6,470

15,089

12,901

Property expenses3

828

1,174

1,837

2,588

Depreciation and amortization

22,074

17,184

42,387

32,830

Provision for impairment of real estate

6,258

398

10,193

6,120

Change in provision for loan losses

107

(166

)

167

(128

)

Total expenses

36,293

25,060

69,673

54,311

Other operating income:

Gain on dispositions of real estate, net

10,094

3,710

11,752

7,498

Income from operations

45,247

35,716

83,646

58,805

Other (expense)/income:

Loss on debt extinguishment4

(4,461

)

(2,138

)

(4,461

)

Interest expense

(9,190

)

(7,811

)

(18,350

)

(15,489

)

Interest income

30

17

48

37

Income before income tax expense

36,087

23,461

63,206

38,892

Income tax expense

275

61

576

117

Net income

35,812

23,400

62,630

38,775

Net income attributable to non-controlling interests

(159

)

(116

)

(278

)

(196

)

Net income attributable to stockholders

$

35,653

$

23,284

$

62,352

$

38,579

Basic weighted-average shares outstanding

131,271,882

116,318,386

129,068,197

111,678,562

Basic net income per share

$

0.27

$

0.20

$

0.48

$

0.34

Diluted weighted-average shares outstanding

132,019,501

117,513,344

129,983,198

112,770,501

Diluted net income per share

$

0.27

$

0.20

$

0.48

$

0.34

_________________

1.

Includes contingent rent (based on a percentage of the tenant’s gross sales at the leased property) of $159, $62 ,$315 and $231 for the three and six months ended June 30, 2022 and 2021, respectively.

2.

Includes reimbursable income from the Company’s tenants of $501, $399, $1,054 and $852 for the three and six months ended June 30, 2022 and 2021, respectively.

3.

Includes reimbursable expenses from the Company’s tenants $500, $399, $1,054 and $852 for the three and six months ended June 30, 2022 and 2021, respectively.

4.

During the six months ended June 30, 2022, includes debt extinguishment costs associated with the Company’s restructuring of its credit and term loan facilities and, during the three and six months ended June 30, 2021, includes debt extinguishment costs associated with the full repayment of the Company’s remaining secured debt.


Contacts

Investor/Media:
Essential Properties Realty Trust, Inc.

Daniel Donlan, Senior Vice President, Capital Markets

609-436-0619

info@essentialproperties.com

Read full story here
Categories
Business

Anser Advisory earns top industry recognitions for 2022

SANTA ANA, Calif. — (BUSINESS WIRE) — #anseradvisoryAnser Advisory, a leading national capital program and project advisory firm, announced today that it earned multiple industry honors. Engineering News-Record (ENR) magazine ranked Anser Advisory 14th for the Top 50 Program Management Firms and 21st on the Top 100 Professional Services Firms list (previously known as the Top 100 Construction Management for Fee firms list).


Additionally, Anser Advisory landed on Zweig Group’s Hot Firms list, taking the number 2 spot as the fastest-growing AEC firm for the third time in a row. This marks the fourth consecutive year Anser Advisory has been ranked by Zweig Group.


ENR’s national industry list is published annually and ranks companies according to revenue for professional services performed in the previous year. Zweig honors the fastest growing firms in the architecture, engineering, planning, environmental and construction (AEC) industry. Firms are ranked based on three-year growth in revenue, by both percentage and dollar growth.


“I am incredibly appreciative of all of Anser Advisory’s clients who have continued to engage us as their trusted advisor in delivering essential infrastructure and critical missions,” said Anser Advisory CEO Bryan Carruthers. “I am equally proud of our team of world-class talent that pushes us to redefine consulting each day. We grow at Anser, first and foremost, to provide career growth opportunities for our employees, and our consistent ranking as one of the fastest growing firms in the industry is testament to the incredible work that all my colleagues do every day.”


About Anser Advisory

Anser Advisory is an ENR Top 50 Program Management firm and Great Place To Work ® designated 2021 Best Workplaces in Consulting & Professional Services™ firm. Anser Advisory specializes in consulting services that include deep subject matter expertise across acquisition and procurement management, security consulting, enterprise technology management, training solutions, program controls, and project, program, and agency construction management. Anser Advisory professionals support civil infrastructure clients, social infrastructure clients, and federal intelligence and defense clients. Anser Advisory is a portfolio company of Sterling Investment Partners.


ALASKA | CALIFORNIA | COLORADO | FLORIDA | ILLINOIS | MASSACHUSETTS | NEW YORK | NEW JERSEY | NORTH CAROLINA | OHIO | PENNSYLVANIA | TEXAS | VIRGINIA

For More Information:

About Anser Advisory:

www.anseradvisory.com

ENR Press Release:

https://www.enr.com/articles/54336-top-100-professional-service-firms-time-management-needs-rise

Zweig Group Press Release:

2022 Hot Firm Award Winners Announced (zweiggroup.com)

Contacts

Juliana Lee

marketing@anseradvisory.com

Categories
Business Science

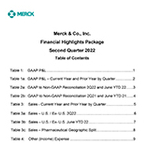
Merck announces second-quarter 2022 financial results

  • Merck Delivers Robust Sales Growth and Important Clinical Advancements in Second Quarter
  • Second-Quarter 2022 Worldwide Sales Were $14.6 Billion, an Increase of 28% From Second Quarter 2021; LAGEVRIO Sales Were $1.2 Billion, Growth Excluding LAGEVRIO Was 18%; Growth Excluding LAGEVRIO and the Impact From Foreign Exchange Was 20%; Sales Growth Favorably Impacted by COVID-19 Recovery
    • KEYTRUDA Sales Grew 26% to $5.3 Billion; Excluding the Impact From Foreign Exchange, Sales Grew 30%
    • GARDASIL/GARDASIL 9 Sales Grew 36% to $1.7 Billion; Excluding the Impact From Foreign Exchange, Sales Grew 40%
  • Second-Quarter 2022 GAAP EPS From Continuing Operations Was $1.55; Second-Quarter 2022 Non-GAAP EPS Was $1.87
  • Advanced and Expanded Pipeline:
    • The U.S. Food and Drug Administration (FDA) Approved Merck’s VAXNEUVANCE for the Prevention of Invasive Pneumococcal Disease in Infants and Children
    • The U.S. Centers for Disease Control and Prevention (CDC) Advisory Committee on Immunization Practices Unanimously Voted to Provisionally Recommend Use of Merck’s VAXNEUVANCE as an Option for Pneumococcal Vaccination in Infants and Children
    • Merck Announced Positive Results From a Phase 1/2 Study for V116, Merck’s Investigational Pneumococcal 21-Valent Conjugate Vaccine for Adults, and Enrolled the First Patient Into the Phase 3 STRIDE-3 Trial Evaluating V116 in Vaccine-Naïve Adults
    • The European Commission (EC) Approved Four Indications for KEYTRUDA
  • 2022 Continuing Operations Financial Outlook:
    • Company Raises and Narrows Expected Full-Year 2022 Worldwide Sales Range To Be Between $57.5 Billion and $58.5 Billion, Reflecting Full-Year Growth of 18% to 20%, Including Negative Impact From Foreign Exchange of Approximately 3%
    • Company Expects Full-Year 2022 GAAP EPS To Be Between $5.89 and $5.99; Company Narrows Expected Full-Year 2022 Non-GAAP EPS Range To Be Between $7.25 and $7.35, Including Negative Impact From Foreign Exchange of Approximately 3%


RAHWAY, N.J. — (BUSINESS WIRE) — $MRK #MRK–Merck (NYSE: MRK), known as MSD outside the United States and Canada, recently announced financial results for the second quarter of 2022.


I continue to be immensely proud of how the Merck team is performing in all facets of our business — scientifically, commercially and operationally,” said Robert M. Davis, chief executive officer and president. “Our strategy is working and our future is bright. I am very confident that we are well-positioned to achieve our near- and long-term goals, anchored by our commitment to deliver innovative medicines and vaccines to patients and value to all of our stakeholders, including shareholders.”


Financial Summary

Financial information presented in this release reflects Merck’s results on a continuing operations basis, which excludes Organon & Co. that was spun-off on June 2, 2021.


$ in millions, except EPS amounts

Second Quarter

2022

2021

Change

Change

Ex-

Exchange

Sales

$14,593

$11,402

28%

31%

GAAP net income1

3,944

1,213

N/M**

N/M

Non-GAAP net income that excludes certain items1,2*

4,743

1,559

N/M

N/M

GAAP EPS

1.55

0.48

N/M

N/M

Non-GAAP EPS that excludes certain items2*

1.87

0.61

N/M

N/M

*Refer to table on page 10

**Not meaningful


Generally accepted accounting principles (GAAP) earnings per share (EPS) assuming dilution was $1.55 for the second quarter of 2022. Non-GAAP EPS of $1.87 for the second quarter of 2022 excludes acquisition- and divestiture-related costs, restructuring costs, as well as income and losses from investments in equity securities. In 2022, the company changed the treatment of certain items for purposes of its non-GAAP reporting. Results for 2021 have been recast to conform to the new presentation, which reduced previously reported second-quarter 2021 non-GAAP EPS of $1.31, resulting in revised non-GAAP EPS of $0.61. For more information, refer to the Form 8-K filed by the company on April 21, 2022.


Year-to-date results can be found in the attached tables.


Vaccines Program Highlights

  • The FDA approved an expanded indication for VAXNEUVANCE (Pneumococcal 15-valent Conjugate Vaccine) to include infants and children. VAXNEUVANCE is now indicated to help prevent invasive pneumococcal disease caused by the serotypes in the vaccine in individuals six weeks and older.
  • The CDC Advisory Committee on Immunization Practices unanimously voted to provisionally recommend use of VAXNEUVANCE as an option to the currently available 13-valent pneumococcal conjugate vaccine (PCV13) for children under 19 years according to currently recommended PCV13 dosing and schedules. These provisional recommendations will be reviewed by the director of the CDC and the Department of Health and Human Services, and final recommendations will become official when published in the CDC’s Morbidity and Mortality Weekly Report.
  • Merck presented positive results from the Phase 1/2 study for V116, Merck’s investigational Pneumococcal 21-Valent Conjugate Vaccine designed to target serotypes that account for 85% of all invasive pneumococcal diseases in U.S. adults 65 years and older as of 20193, and enrolled the first patient into the Phase 3 STRIDE-3 trial evaluating V116 in vaccine-naïve adults. V116 contains eight serotypes not included in any currently licensed pneumococcal vaccine.


Oncology Program Highlights

  • Merck announced the following regulatory milestones for KEYTRUDA (pembrolizumab):
    • The FDA accepted an application seeking approval for KEYTRUDA as adjuvant therapy for stage IB (>4 centimeters), II or IIIA non-small cell lung cancer (NSCLC) following complete surgical resection based on data from the Phase 3 KEYNOTE-091 trial. The FDA has set a Prescription Drug User Fee Act date of January 29, 2023, however further data may be provided during the review process that may delay this date.
    • The EC approved four indications for KEYTRUDA:
      • Approved as monotherapy for the adjuvant treatment of adult and adolescent patients (>12 years of age) with stage IIB or IIC melanoma and who have undergone complete resection, based on results from the KEYNOTE-716 trial. The EC also approved expanding the indication for KEYTRUDA in advanced and stage III melanoma to include adolescent patients 12 years and older.
      • Approved in combination with chemotherapy as neoadjuvant treatment, and then continued as adjuvant monotherapy after surgery, for adults with locally advanced or early-stage triple-negative breast cancer (TNBC) at high risk of recurrence, based on results from the KEYNOTE-522 trial.
      • Approved as monotherapy for the treatment of certain adult patients with microsatellite instability-high (MSI-H) or mismatch repair deficient (dMMR) tumors for five types of cancer: unresectable or metastatic colorectal, gastric, small intestine or biliary cancer, as well as advanced or recurrent MSI-H/dMMR endometrial cancer, based on results from the KEYNOTE-164 and KEYNOTE-158 trials.
      • Approved in combination with chemotherapy, with or without bevacizumab, for patients with persistent, recurrent or metastatic cervical cancer whose tumors express PD-L1 (Combined Positive Score ≥ 1), based on results from the KEYNOTE 826 trial.
  • The European Medicines Agency Committee for Medicinal Products for Human Use adopted a positive opinion for Lynparza (olaparib), an oral poly (ADP-ribose) polymerase (PARP) inhibitor being co-developed and co-commercialized with AstraZeneca, as adjuvant treatment for patients with germline BRCA-mutated, human epidermal growth factor 2-negative high-risk early breast cancer who have been treated with neoadjuvant or adjuvant chemotherapy, based on results from the Phase 3 OlympiA trial.
  • At the 2022 American Society of Clinical Oncology Annual Meeting, Merck presented new data in more than 25 types of cancer and held an investor event to highlight key data and provide updates from its late-stage development programs and diverse early-stage pipeline.


Global Pharmaceuticals Program Highlight

  • Merck, in collaboration with Ridgeback Biotherapeutics, announced data from a pre-specified exploratory analysis for LAGEVRIO (molnupiravir) from the Phase 3 MOVe-OUT study indicating that a lower proportion of participants treated with LAGEVRIO had an acute care visit or COVID-19-related acute care visit versus placebo. Additionally, in a post-hoc subgroup analysis, fewer LAGEVRIO-treated patients who were hospitalized post-randomization in MOVe-OUT required respiratory interventions (including invasive mechanical ventilation) compared to those who received placebo.


Second-Quarter Revenue Performance

The following table reflects sales of the company’s top pharmaceutical products, as well as sales of Animal Health products.


Second Quarter

$ in millions

2022

2021

Change

Change Ex-

Exchange

Total Sales

$14,593

$11,402

28%

31%

Pharmaceutical

12,756

9,980

28%

33%

KEYTRUDA

5,252

4,176

26%

30%

GARDASIL / GARDASIL 9

1,674

1,234

36%

40%

JANUVIA / JANUMET

1,233

1,261

-2%

3%

LAGEVRIO

1,177

0

PROQUAD, M-M-R II and

VARIVAX

578

516

12%

14%

BRIDION

Lynparza*

426

275

387

248

10%

11%

15%

17%

Lenvima*

231

181

28%

33%

SIMPONI

ROTATEQ

181

173

202

208

-10%

-17%

1%

-14%

Animal Health

1,467

1,472

0%

5%

Livestock

826

821

1%

6%

Companion Animals

641

651

-2%

3%

Other Revenues**

370

(50)

N/M***

N/M

*Alliance revenue for this product represents Merck’s share of profits, which are product sales net of cost of sales and

commercialization costs.

**Other revenues are comprised primarily of third-party manufacturing sales and miscellaneous corporate revenues, including

revenue-hedging activities. The revenue-hedging activities resulted in negative revenue in the second quarter of 2021.

***Not meaningful


Pharmaceutical Revenue

Second-quarter pharmaceutical sales increased 28% to $12.8 billion. Pharmaceutical sales growth in the second quarter was 16% excluding LAGEVRIO sales, and was primarily driven by oncology, vaccines and hospital acute care products. The COVID-19 pandemic unfavorably affected sales in the second quarter of 2021 by approximately $400 million, which favorably impacted the growth rate in the second quarter of 2022.


LAGEVRIO sales totaled $1.2 billion for the second quarter, primarily consisting of sales in Japan and the U.K. The initial commitment of LAGEVRIO to the U.S. was fulfilled in the first quarter of 2022.


Growth in oncology was largely driven by higher sales of KEYTRUDA, which rose 26% to $5.3 billion in the quarter. Global sales growth of KEYTRUDA reflects continued strong momentum from metastatic indications including certain types of NSCLC, renal cell carcinoma, head and neck squamous cell carcinoma, TNBC and MSI-H cancers, and increased uptake across recent earlier-stage launches including certain types of neoadjuvant/adjuvant TNBC in the U.S.


Also contributing to higher sales in oncology was a 28% increase in Lenvima (lenvatinib) alliance revenue driven primarily by higher demand in the U.S., and an 11% increase in Lynparza alliance revenue reflecting continued demand globally, particularly in the U.S. driven by strong uptake in earlier-stage breast cancer.


Growth in vaccines was primarily driven by higher combined sales of GARDASIL (Human Papillomavirus Quadrivalent [Types 6, 11, 16 and 18] Vaccine, Recombinant) and GARDASIL 9 (Human Papillomavirus 9-valent Vaccine, Recombinant) vaccines to prevent certain cancers and other diseases caused by human papillomavirus (HPV). Second-quarter GARDASIL/GARDASIL 9 sales grew 36% to $1.7 billion primarily driven by strong demand outside of the U.S., particularly in China, which also benefited from increased supply.


Growth in hospital acute care reflects higher demand globally for BRIDION (sugammadex) injection 100 mg/mL, a medicine for the reversal of neuromuscular blockade induced by rocuronium bromide or vecuronium bromide in adults and pediatric patients aged 2 years and older undergoing surgery. Sales increased 10% to $426 million, primarily due to an increase in its share among neuromuscular blockade reversal agents and an increase in surgical procedures during the second quarter. Growth in hospital acute care also reflects higher sales of ZERBAXA (ceftolozane and tazobactam), a combination cephalosporin antibacterial and beta-lactamase inhibitor for the treatment of adults with certain bacterial infections. Sales of $46 million resulted from the phased resupply initiated in the fourth quarter of 2021 that is being expanded to additional markets during 2022.


Pharmaceutical sales growth was partially offset by lower combined sales of ISENTRESS/ISENTRESS HD (raltegravir), an HIV integrase inhibitor used in combination with other antiretroviral agents for the treatment of HIV-1 infection, which declined 24% to $147 million reflecting lower global demand. Pharmaceutical sales growth was also partially offset by lower combined sales of JANUVIA (sitagliptin) and JANUMET (sitagliptin and metformin HCI), which declined 2% to $1.2 billion, primarily reflecting the unfavorable effect of foreign exchange and lower pricing in certain international markets, partially offset by the impact of a prior year unfavorable adjustment to rebate reserves in the U.S. The company lost market exclusivity for JANUVIA and JANUMET in China in July and will lose market exclusivity in the European Union in September.


Animal Health Revenue

Animal Health sales totaled $1.5 billion for the second quarter of 2022, flat compared to the second quarter of 2021. Excluding the unfavorable effect from foreign exchange, Animal Health sales grew 5%. Sales were driven primarily by livestock products reflecting higher demand globally for ruminant and poultry products. Sales in companion animal products were primarily driven by the BRAVECTO (fluralaner) parasiticide line of products.


Second-Quarter Expense, EPS and Related Information

The tables below present selected expense information.


$ in millions

Second Quarter 2022

GAAP

Acquisition-

and

Divestiture-

Related

Costs4

Restructuring

Costs

(Income)

Loss from

Investments

in Equity

Securities

Certain

Other

Items

Non-

GAAP2

Cost of sales

$4,216

$451

$67

$-

$-

$3,698

Selling, general and administrative

2,512

65

27

2,420

Research and development

2,798

12

22

2,764

Restructuring costs

142

142

Other (income) expense, net

438

2

234

202

Second Quarter 2021

Cost of sales

$3,104

$345

$38

$-

$37

$2,684

Selling, general and administrative

2,281

25

2

2,254

Research and development

4,321

16

6

4,299

Restructuring costs

82

82

Other (income) expense, net

(103)

117

(258)

38


GAAP Expense, EPS and Related Information

Gross margin was 71.1% for the second quarter of 2022 compared to 72.8% for the second quarter of 2021. The decrease primarily reflects impacts from LAGEVRIO, which has a lower gross margin due to profit sharing with Ridgeback, as well as higher inventory write-offs, higher manufacturing costs and higher acquisition- and divestiture-related costs. The gross margin decline was partially offset by the favorable effects of product mix.


Selling, general and administrative (SG&A) expenses were $2.5 billion in the second quarter of 2022, an increase of 10% compared to the second quarter of 2021. The increase primarily reflects higher promotion and administrative costs, including compensation and benefit costs, as well as higher acquisition- and divestiture-related costs, partially offset by the favorable impact of foreign exchange.


Research and development (R&D) expenses were $2.8 billion in the second quarter of 2022 compared to $4.3 billion in the second quarter of 2021. The decrease was primarily driven by a $1.7 billion charge in the prior year for the acquisition of Pandion Therapeutics, Inc. (Pandion). The decline was partially offset by higher clinical development spending, higher compensation and benefits, and higher investments in technology in support of the digital enablement of Merck’s research operations.


Other (income) expense, net, was $438 million of expense in the second quarter of 2022 compared to $103 million of income in the second quarter of 2021, primarily due to net unrealized losses from investments in equity securities in the second quarter of 2022, compared to net unrealized income from investments in equity securities in the second quarter of 2021. Other (income) expense, net, in the second quarter of 2022 also reflects higher pension settlement costs of approximately $100 million compared to the second quarter of 2021.


The effective income tax rate was 12.0% for the second quarter of 2022 compared to 29.3% in the second quarter of 2021. The effective income tax rate in the second quarter of 2021 reflects no tax benefit recognized on the charge for the acquisition of Pandion.


GAAP EPS was $1.55 for the second quarter of 2022 compared to $0.48 for the second quarter of 2021.


Non-GAAP Expense, EPS and Related Information

Non-GAAP gross margin was 74.7% for the second quarter of 2022 compared to 76.5% for the second quarter of 2021. The decrease in non-GAAP gross margin primarily reflects impacts from LAGEVRIO, which has a lower gross margin due to profit sharing with Ridgeback, as well as higher inventory write-offs and manufacturing costs. The gross margin decline was partially offset by the favorable effects of product mix.


Non-GAAP SG&A expenses were $2.4 billion in the second quarter of 2022, an increase of 7% compared to the second quarter of 2021. The increase primarily reflects higher promotion and administrative costs, including compensation and benefit costs, partially offset by the favorable impact of foreign exchange.


Non-GAAP R&D expenses were $2.8 billion in the second quarter of 2022 compared to $4.3 billion in the second quarter of 2021. The decrease primarily reflects a $1.7 billion charge in the prior year for the acquisition of Pandion. The decline was partially offset by higher clinical development spending, higher compensation and benefits, and higher investments in technology in support of the digital enablement of Merck’s research operations.


Non-GAAP other (income) expense, net, was $202 million of expense in the second quarter of 2022 compared to $38 million of expense in the second quarter of 2021 reflecting higher pension settlement costs of approximately $100 million.


The non-GAAP effective income tax rate was 13.8% for the second quarter of 2022 compared to 26.7% in the second quarter of 2021. The non-GAAP effective income tax rate in the second quarter of 2021 reflects no tax benefit recognized on the charge for the acquisition of Pandion.


Non-GAAP EPS was $1.87 for the second quarter of 2022 compared to $0.61 for the second quarter of 2021.


A reconciliation of GAAP to non-GAAP net income and EPS is provided in the table that follows.


Second Quarter

$ in millions, except EPS amounts

2022

2021

EPS

GAAP EPS

$1.55

$0.48

Difference

0.32

0.13

Non-GAAP EPS that excludes items listed below2

$1.87

$0.61

Net Income

GAAP net income1

$3,944

$1,213

Difference

799

346

Non-GAAP net income that excludes items listed below1,2

$4,743

$1,559

Decrease (Increase) in Net Income Due to Excluded Items:

Acquisition- and divestiture-related costs4

$530

$503

Restructuring costs

258

128

Loss (income) from investments in equity securities

234

(258)

Charge for the discontinuation of COVID-19 development programs

37

Net decrease (increase) in income before taxes

1,022

410

Estimated income tax (benefit) expense

(223)

(64)

Decrease (increase) in net income

$799

$346


Financial Outlook

Beginning in 2022, Merck no longer excludes expenses for upfront and milestone payments related to collaborations and licensing agreements, or charges related to pre-approval assets obtained in transactions accounted for as asset acquisitions from its non-GAAP results. Historically, the company excluded these charges to the extent they were considered by the company to be significant to the results of a particular period. These changes were made to align with views expressed by the U.S. Securities and Exchange Commission. Prior periods have been recast to reflect this change. For 2021, non-GAAP results have been recast to include $1.7 billion of incremental R&D expense, resulting in revised full-year 2021 EPS of $5.37.


Business development continues to be a priority for Merck, as demonstrated by the company’s recent collaboration with Orion announced in July for the development and commercialization of ODM-208, an investigational steroid synthesis inhibitor for the treatment of metastatic castration-resistant prostate cancer. The GAAP and non-GAAP financial outlooks include the upfront payment of $290 million, which will have an estimated $0.09 negative impact on full-year EPS.


As an on-going practice, the financial outlook will not include significant potential business development transactions.


Merck continues to experience strong global underlying demand across its key pillars of growth, particularly in oncology and vaccines. As a result, Merck is raising and narrowing its full-year guidance for sales.


At mid-July 2022 exchange rates, Merck expects sales growth of 18% to 20% in 2022, with full-year sales estimated to be between $57.5 billion and $58.5 billion, including a negative impact from foreign exchange of approximately 3%, a greater than 1% incremental negative impact from prior sales guidance.


Merck’s estimated full-year non-GAAP effective income tax rate is unchanged and expected to be between 13.5% and 14.5%.


Merck expects its estimated full-year 2022 GAAP EPS to be between $5.89 and $5.99.


Merck is narrowing its expected full-year 2022 non-GAAP EPS range to be between $7.25 and $7.35, including a negative impact from foreign exchange of approximately 3% at mid-July exchange rates. Operational strength of approximately $0.25 that would have resulted in an increase from the previous guidance range is being offset by the following negative impacts:


  • The upfront payment of $290 million to Orion
  • A greater than 1% incremental negative impact from foreign exchange
  • Higher U.S. pension settlement expense


The non-GAAP range excludes acquisition- and divestiture-related costs and costs related to restructuring programs as well as income and losses from investments in equity securities.


The company continues to expect sales of $5.0 billion to $5.5 billion from LAGEVRIO for full-year 2022. Merck shares profits equally with its partner, Ridgeback, which is reflected in cost of sales.


The following table summarizes the company’s full-year 2022 financial guidance.


GAAP

Non-GAAP2

Sales

$57.5 to $58.5 billion

$57.5 to $58.5 billion*

Operating expenses

$21.0 to $22.0 billion

$20.5 to $21.5 billion

Effective tax rate

12% to 13%

13.5% to 14.5%

EPS**

$5.89 to $5.99

$7.25 to $7.35

*The company does not have any non-GAAP adjustments to sales.

**EPS guidance for 2022 assumes a share count (assuming dilution) of approximately 2.54 billion shares.


A reconciliation of anticipated 2022 GAAP EPS to non-GAAP EPS and the items excluded from non-GAAP EPS are provided in the table below.


$ in millions, except EPS amounts

Full-Year 2022

GAAP EPS

$5.89 to $5.99

Difference

$1.36

Non-GAAP EPS that excludes items listed below2

$7.25 to $7.35

Acquisition- and divestiture-related costs

Restructuring costs

(Income) loss from investments in equity securities

$2,750

550

1,050

Net decrease (increase) in income before taxes

4,350

Estimated income tax (benefit) expense

(900)

Decrease (increase) in net income

$3,450

Contacts

Media Contacts:

Johanna Herrmann

(617) 216-6029

Melissa Moody

(215) 407-3536

Investor Contacts:

Peter Dannenbaum

(908) 740-1037

Steven Graziano

(908) 740-6582

Read full story here

Categories
Business Special/Sponsored Content

AM Best revises outlooks to stable for Central States Health & Life Co. of Omaha and its subsidiaries

OLDWICK, N.J. — (BUSINESS WIRE) — #insuranceAM Best has revised the outlooks to stable from negative and affirmed the Financial Strength Rating of A- (Excellent) and the Long-Term Issuer Credit Ratings (Long-Term ICR) of “a-” (Excellent) of Central States Health & Life Co. of Omaha (Omaha, NE) and its subsidiaries, Censtat Life Assurance Company (Phoenix, AZ) and Censtat Casualty Company (Omaha, NE), collectively known as CSO.

These Credit Ratings (ratings) reflect CSO’s balance sheet strength, which AM Best assesses as very strong, as well as its adequate operating performance, limited business profile and appropriate enterprise risk management.


The stable outlooks reflect the company maintaining a very strong level of balance sheet strength through capital growth and a favorable risk-adjusted capital position. Premium growth has been on a positive trend over the past few years and the diversified portfolio of alternative investments has produced favorable returns contributing to profitable operations. This has been accomplished in an increasingly challenging operating environment within its core credit insurance product line primarily due to intense competition, unfavorable auto industry trends and regulatory changes.


CSO has maintained its credit insurance market share by expanding its geographic footprint on a national scale. AM Best also notes CSO’s re-entry into the Medicare supplement business a few years ago. These actions are expected to diversify the company’s product and earnings profile. However, AM Best views the Medicare supplement business to be highly competitive and commoditized, and CSO is not expected to be profitable on this block for a few years. The organization also recently launched a new dental, vision and hearing policy to help further diversify its senior market portfolio. Management is looking for products that could leverage the established broker network. In addition, the organization continues to seek acquisitions, alliances and investment opportunities for new blocks of business. AM Best will continue to monitor the company’s efforts to expand into debt cancellation programs in the credit union market, as well as its progress toward establishing a trend of profitable growth across its book of businesses, and more specifically in the newly entered Medicare supplement space. The profitable expansion and diversification of its revenue and earnings across its suite of products will be a key to ratings stability for the organization going forward.


This press release relates to Credit Ratings that have been published on AM Best’s website. For all rating information relating to the release and pertinent disclosures, including details of the office responsible for issuing each of the individual ratings referenced in this release, please see AM Best’s Recent Rating Activity web page. For additional information regarding the use and limitations of Credit Rating opinions, please view Guide to Best’s Credit Ratings. For information on the proper use of Best’s Credit Ratings, Best’s Performance Assessments, Best’s Preliminary Credit Assessments and AM Best press releases, please view Guide to Proper Use of Best’s Ratings & Assessments.


AM Best is a global credit rating agency, news publisher and data analytics provider specializing in the insurance industry. Headquartered in the United States, the company does business in over 100 countries with regional offices in London, Amsterdam, Dubai, Hong Kong, Singapore and Mexico City. For more information, visit www.ambest.com.


Copyright © 2022 by A.M. Best Rating Services, Inc. and/or its affiliates. ALL RIGHTS RESERVED.

Contacts

Jeffrey Lane
Senior Financial Analyst
+1 908 439 2200, ext. 5567
jeffrey.lane@ambest.com

Joseph Zazzera, MBA
Director
+1 908 439 2200, ext. 5797
joseph.zazzera@ambest.com

Christopher Sharkey
Manager, Public Relations
+1 908 439 2200, ext. 5159
christopher.sharkey@ambest.com

Jeff Mango
Managing Director,
Strategy & Communications
+1 908 439 2200, ext. 5204
jeffrey.mango@ambest.com