Categories
Business

Mercury Insurance offers contactless home inspections to policyholders in New York and New Jersey through Flyreel

Mercury’s home inspection app minimizes health risks by eliminating the need for outsiders to make an in-person home visit

LOS ANGELES–(BUSINESS WIRE)–Today, Mercury Insurance announced that the company is offering New York and New Jersey homeowners policyholders DIY inspection services using an advanced Artificial Intelligence (AI) assistant. Created by Flyreel, the app guides homeowners through a self-inspection of their property and gives them the option for a contactless experience, helping policyholders maintain their physical distance from those outside of the household during the COVID-19 pandemic. The AI assistant is available to download as a mobile app from the Apple App Store and Google Play.

“We do so much with smartphones now that giving our insureds the ability to use photos and video to capture and verify the characteristics of their property made so much sense,” said Holly Sacks, Mercury Insurance portfolio underwriter. “The AI in our app is top-class, making it super simple to complete a self-inspection. The step-by-step instructions are easy to follow and fun to use!”

New Mercury homeowner policyholders will be emailed a link to download the app and activate it. Then, they can complete the self-inspection at their leisure with no appointment needed. The virtual inspection is conducted with state-of-the-art AI, high fidelity video and a conversation feature to streamline the experience while capturing everything Mercury needs to accurately underwrite a policy. It also helps catalog belongings and building materials in the event the customer needs to file a claim. On average, the self-inspection process takes less than 30 minutes.

Flyreel, Mercury’s home inspection app technology partner, is the pioneer in developing advanced AI to help insurance providers protect policyholders and their property using AI-assisted, self-service inspections.

“We’re grateful for the opportunity to support Mercury Insurance as they push the envelope of innovation, deploying the best of today’s technology to better serve their customers,” said Cole Winans, CEO of Flyreel. “Their relentless commitment to protecting homeowners while delivering an industry-leading customer experience makes us proud to be their partner.”

Visit https://www.mercuryinsurance.com/insurance/homeowners/ to learn more about Mercury’s products and services.

About Mercury Insurance

Mercury Insurance (MCY) is a multiple-line insurance organization predominantly offering personal automobile, homeowners and business insurance through a network of independent agents in Arizona, California, Florida, Georgia, Illinois, Nevada, New Jersey, New York, Oklahoma, Texas and Virginia. Since 1962, Mercury has specialized in offering quality insurance at affordable prices. For more information, visit www.mercuryinsurance.com or Facebook and follow the company on Twitter.

About Flyreel

Flyreel provides Total Property UnderstandingTM for underwriting, loss control and claims. Flyreel’s advanced AI assistant guides users through fully configurable workflows. As users scan their property with their smartphone camera, Flyreel’s proprietary computer vision technology automatically documents critical property data like hazards, risks, features, materials and more. Flyreel’s AI Assistant can “react and respond” to data collected by the policyholder, adapting and customizing conversational workflows based on the unique attributes that it “sees” in near real-time. To learn more about Flyreel, visit https://www.flyreel.co/.

Contacts

PCG – Kyle Reuter (424) 903-3657

kreuter@pacificcommunicationsgroup.com

Flyreel, Inc. – Alyson Austin (949) 403-0484

alyson@gaffneyaustin.com

Categories
Business

Clouds on the horizon for many U.S. homeowners: Overall delinquency rates beginning to climb, according to CoreLogic Loan performance insights report

  • Early-stage and adverse delinquency rates increased for the second consecutive month – high correlation to geographies most impacted by COVID-19
  • All 50 states logged year-over-year increases in overall delinquencies this May
  • Over 75% of U.S. metro areas experienced an increase in serious delinquency rates

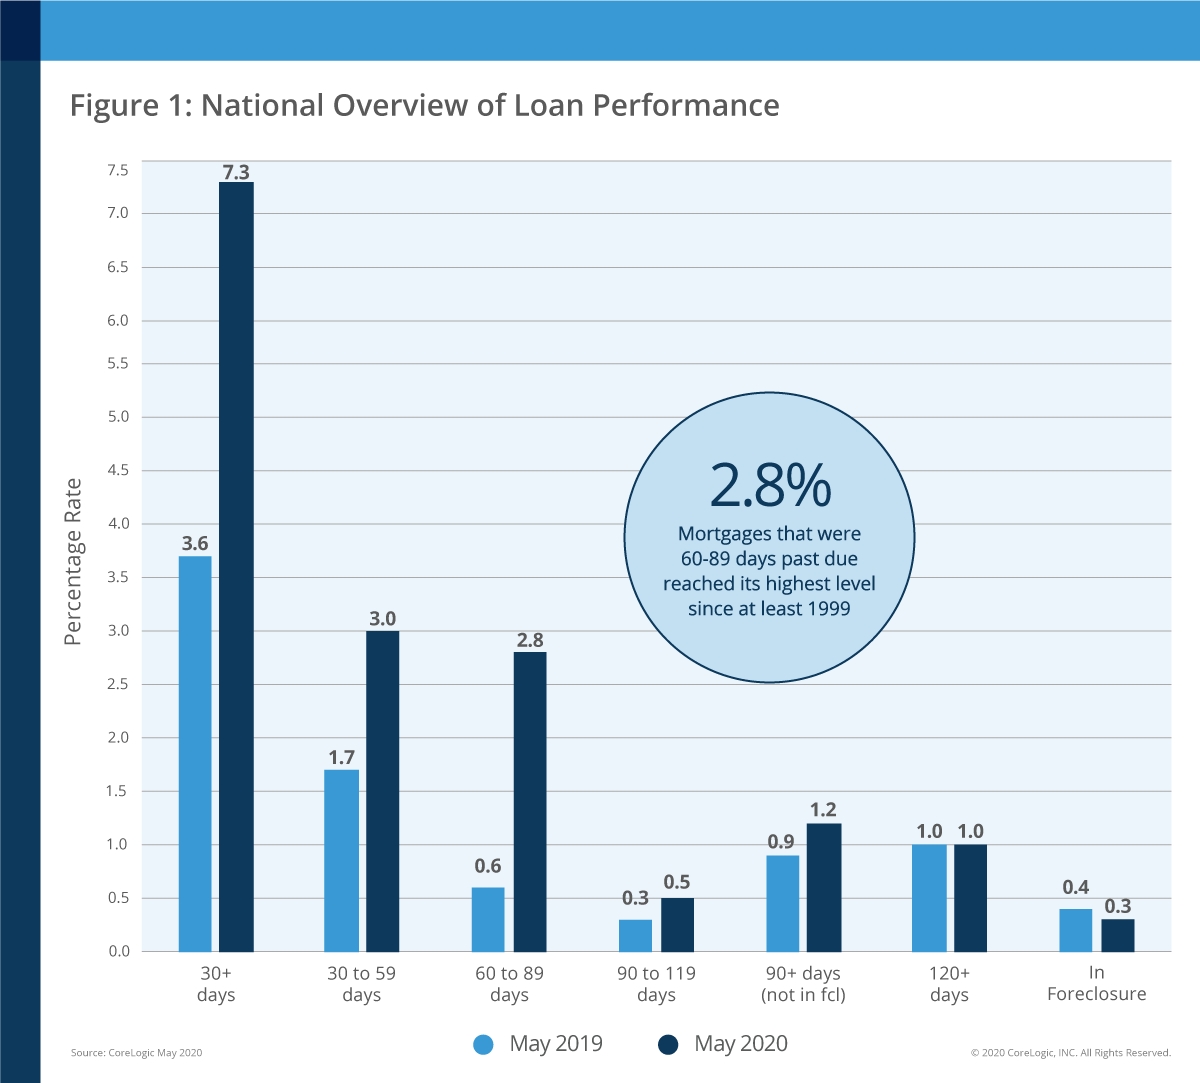
IRVINE, Calif.–(BUSINESS WIRE)–#Foreclosure–CoreLogic® (NYSE: CLGX), a leading global property information, analytics and data-enabled solutions provider, today released its monthly Loan Performance Insights Report for May 2020. On a national level, 7.3% of mortgages were in some stage of delinquency (30 days or more past due, including those in foreclosure). This represents a 3.7-percentage point increase in the overall delinquency rate compared to 3.6% in May 2019.


To gain an accurate view of the mortgage market and loan performance health, CoreLogic examines all stages of delinquency, including the share that transition from current to 30 days past due. In May 2020, the U.S. delinquency and transition rates, and their year-over-year changes, were as follows:

  • Early-Stage Delinquencies (30 to 59 days past due): 3%, up from 1.7% in May 2019.
  • Adverse Delinquency (60 to 89 days past due): 2.8%, up from 0.6% in May 2019.
  • Serious Delinquency (90 days or more past due, including loans in foreclosure): 1.5%, up from 1.3% in May 2019. This is the first year-over-year increase in the serious delinquency rate since November 2010.
  • Foreclosure Inventory Rate (the share of mortgages in some stage of the foreclosure process): 0.3%, down from 0.4% in May 2019. This is the second consecutive month the U.S. foreclosure rate was at its lowest level for any month since at least January 1999.
  • Transition Rate (the share of mortgages that transitioned from current to 30 days past due): 2.2%, up from 0.8% in May 2019. By comparison, in January 2007 — just before the start of the financial crisis — the current- to 30-day transition rate was 1.2%, while it peaked in November 2008 at 2%.

In the months leading up to the pandemic, U.S. mortgage performance was showing signs of sustained improvement. The national unemployment rate matched a 50-year low in February, and overall delinquency had been on an impressive 27 consecutive-month decline. However, by May 2020 — just two months after the coronavirus (COVID-19) was declared a global pandemic — U.S. unemployment surged past 13%, leaving over 4 million homeowners (accounting for more than 8% of all mortgages) little choice but to enter a COVID-19 mortgage forbearance program.

“The national unemployment rate soared from a 50-year low in February 2020, to an 80-year high in April,” said Dr. Frank Nothaft, chief economist at CoreLogic. “With the sudden loss of income, many homeowners are struggling to stay on top of their mortgage loans, resulting in a jump in non-payment.”

Absent further government programs and support, CoreLogic forecasts the U.S. serious delinquency rate to quadruple by the end of 2021, pushing 3 million homeowners into serious delinquency.

“Government and industry relief programs have helped to cushion the initial financial blow of the pandemic for millions of U.S. homeowners,” said Frank Martell, president and CEO of CoreLogic. “COVID-19 and the resulting pressures continue to influence the economic activity of many households. Barring additional intervention from the Federal and State governments, we are likely to see meaningful spikes in delinquencies over the short to medium term.”

All states logged increases in overall delinquency rates in May from a year earlier. New Jersey and Nevada, both still hot spots for the virus, experienced the largest overall delinquency gains with 6.4 percentage-point increases each in May, compared to one year earlier. New York again remained atop the list with a 6.1 percentage-point increase, while Florida experienced a gain of 5.8 percentage points.

On the metro level, nearly every U.S. metropolitan area posted at least a small annual increase in their overall delinquency rate, with tourism destinations such as Miami, Florida (up 9.2 percentage points), and Kahului, Hawaii (up 8.8 percentage points), posting two of the largest increases. Odessa, Texas — which has a local economy strongly tied to the oil industry — also logged a considerable increase, posting an annual gain of 9 percentage points.

Meanwhile, over 75% of all metro areas logged at least a small increase in their serious delinquency rate. Odessa, Texas, and Laredo, Texas, tied for largest increase with gains of 1.1 percentage points each. McAllen, Texas; Midland, Texas and Hattiesburg, Mississippi all followed with gains of 0.7 percentage-points each.

To learn more firsthand information about delinquency and foreclosure trends, join Dr. Frank Nothaft and other leading mortgage experts from CoreLogic during their virtual roundtable this Thursday, August 13, to discuss these various issues at hand. Register for the webinar today here.

The next CoreLogic Loan Performance Insights Report will be released on September 8, 2020, featuring data for June 2020. For ongoing housing trends and data, visit the CoreLogic Insights Blog: www.corelogic.com/insights.

Methodology

The data in The CoreLogic LPI report represents foreclosure and delinquency activity reported through May 2020. The data in this report accounts for only first liens against a property and does not include secondary liens. The delinquency, transition and foreclosure rates are measured only against homes that have an outstanding mortgage. Homes without mortgage liens are not subject to foreclosure and are, therefore, excluded from the analysis. CoreLogic has approximately 75% coverage of U.S. foreclosure data.

Source: CoreLogic

The data provided is for use only by the primary recipient or the primary recipient’s publication or broadcast. This data may not be re-sold, republished or licensed to any other source, including publications and sources owned by the primary recipient’s parent company without prior written permission from CoreLogic. Any CoreLogic data used for publication or broadcast, in whole or in part, must be sourced as coming from CoreLogic, a data and analytics company. For use with broadcast or web content, the citation must directly accompany first reference of the data. If the data is illustrated with maps, charts, graphs or other visual elements, the CoreLogic logo must be included on screen or website. For questions, analysis or interpretation of the data, contact Allyse Sanchez at corelogic@ink-co.com. Data provided may not be modified without the prior written permission of CoreLogic. Do not use the data in any unlawful manner. This data is compiled from public records, contributory databases and proprietary analytics, and its accuracy is dependent upon these sources.

About CoreLogic

CoreLogic (NYSE: CLGX), the leading provider of property insights and solutions, promotes a healthy housing market and thriving communities. Through its enhanced property data solutions, services and technologies, CoreLogic enables real estate professionals, financial institutions, insurance carriers, government agencies and other housing market participants to help millions of people find, buy and protect their homes. For more information, please visit www.corelogic.com.

CORELOGIC and the CoreLogic logo are trademarks of CoreLogic, Inc. and/or its subsidiaries. All other trademarks are the property of their respective owners.

Contacts

Valerie Sheets

CoreLogic

newsmedia@corelogic.com

Categories
Business

New data from HouseCanary reveals COVID-19’s resurgence is creating an attractive ‘seller’s market’ for homeowners

Despite Resurgent Homebuyer Demand, New Listing Volume Dropped 12% on a Week-Over-Week Basis and Net New Listings are Down 17.5% Compared to the Same Point in 2019

Sustained Supply Constraints Throughout the Spring and Summer Have Kept Listing Prices Above Pre-Pandemic Levels Across 29 States

Outlook for a V-Shaped Housing Market Recovery in 2020 Remains Dim as a Result of Recessionary Concerns, Election Cycle Uncertainty and the Current Year-Over-Year Drop in New Listings

SAN FRANCISCO–(BUSINESS WIRE)–HouseCanary, Inc. (“HouseCanary”), a leading provider of residential real estate data and home valuations, today released its latest Market Pulse report, covering 22 listing-derived metrics and comparing data between the week ending July 24, 2020 and the week ending March 13, 2020. The Market Pulse is an ongoing review of proprietary data and insights from HouseCanary’s nationwide platform.


Jeremy Sicklick, Co-founder and Chief Executive Officer of HouseCanary, commented: “The resurgence of COVID-19 has solidified a bona fide seller’s market across more than half of the country. While pandemic uncertainty appears to be sidelining a growing number of prospective home sellers, pent-up demand on the buy-side remains quite strong due to attractive borrowing terms and a surge in first-time homebuyers. Several large states, ranging from California to Florida, have seen their median home price listings rise rather significantly since mid-March. The question that remains is whether this market environment will be able to persist beyond. Our data continues to suggest the probability of a V-shaped housing market recovery remains dim given recessionary concerns, election year uncertainty and the overall decline in listing activity.”

Select findings from this week’s Market Pulse are below. Be sure to review the Market Pulse in full for extensive state-level data.

Weekly New Listing Volume (Single-Family Detached Homes):

  • New listing volume is down 12.2% week-over-week
  • New listing volume is down 21.1% nationwide compared to the week ending March 13, when most COVID-19 measures were implemented
  • Decline in new listing activity since the week ending March 13, broken down by home price:
    • $0-$200k: (-24.9%)
    • $200k-$400k: (-23.4%)
    • $400k-$600k: (-19.3%)
    • $600k-$1mm: (-14.1%)
    • >$1mm: (-7.6%)
  • New listing volume is up 24.1% from its lowest point in mid-April

Total Net New Listings:

  • Since the week ending March 13, there have been 1,146,138 net new listings placed on the market, representing a 17.5% decrease relative to the same period in 2019
  • For the week ending July 24, there were 55,192 net new listings placed on the market, representing a 14.0% decrease compared to the previous week
  • Percentage of total net new listings since March 13, broken down by home price:
    • $0-$200k: 22.5%
    • $200k-$400k: 45.0%
    • $400k-$600k: 17.7%
    • $600k-$1mm: 10.0%
    • >$1mm: 4.8%

Median Listing Price Activity (Single-Family Detached Homes):

  • The median price for new listings has risen in 29 states since the start of COVID-19 in March
  • Several states heavily impacted by the pandemic have seen material listing price growth since the onset of the pandemic:
    • California: +14.7%
    • Kentucky: +12.7%
    • Florida: +7.2%
    • New Jersey: +6.1%
    • Texas: +3.0%

Weekly Contract Volume (Single-Family Detached Homes):

  • Weekly contract volume is down 6.4% week-over-week
  • Percent change in contract volume week-over-week, broken down by home price:
    • $0-$200k: (-4.6%)
    • $200k-$400k: (-6.7%)
    • $400k-$600k: (-8.0%)
    • $600k-$1mm: (-4.9%)
    • >$1mm: (-8.6%)
  • Weekly contract volume is up 19.2% nationwide compared to the week ending March 13, when most COVID-19 measures were implemented
  • Percent change in weekly contract volume since the week ending March 13, broken down by home price:
    • $0-$200k: +5.3%
    • $200k-$400k: +16.0%
    • $400k-$600k: +29.3%
    • $600k-$1mm: +44.8%
    • >$1mm: +51.4%
  • Weekly contract volume is up 85.8% from its lowest level in mid-April

Total Listings Under Contract:

  • Since the week ending March 13, 1,299,238 properties have gone into contract across 41 states, representing a 2.2% decrease relative to the same period in 2019
  • For the week ending July 24, there were 75,662 listings that went under contract nationwide
  • Percentage of total contract volume since the week ending March 13, broken down by home price:
    • $0-$200k: 24.8%
    • $200k-$400k: 45.3%
    • $400k-$600k: 16.9%
    • $600k-$1mm: 9.0%
    • >$1mm: 4.0%

As a nationwide real estate broker, HouseCanary’s broad multiple listing service (“MLS”) participation allows us to evaluate listing data and aggregate the number of new listings as well as the number of new listings going into contract for all single-family detached homes observed in the HouseCanary database. Using this data, HouseCanary continues to track listing volume, new listings, and median list price for 41 states and 50 individual Metropolitan Statistical Areas (“MSAs”).

About HouseCanary:

Founded in 2013, valuation-focused real estate brokerage HouseCanary provides software and services to reshape the real estate marketplace. Financial institutions, investors, lenders, mortgage investors, and consumers turn to HouseCanary for industry-leading valuations, forecasts, and transaction-support tools. These clients trust HouseCanary to fuel acquisition, underwriting, portfolio management, and more. Learn more at www.housecanary.com.

Contacts

Denise Dunckel

press@housecanary.com